Design Process
FoilSim
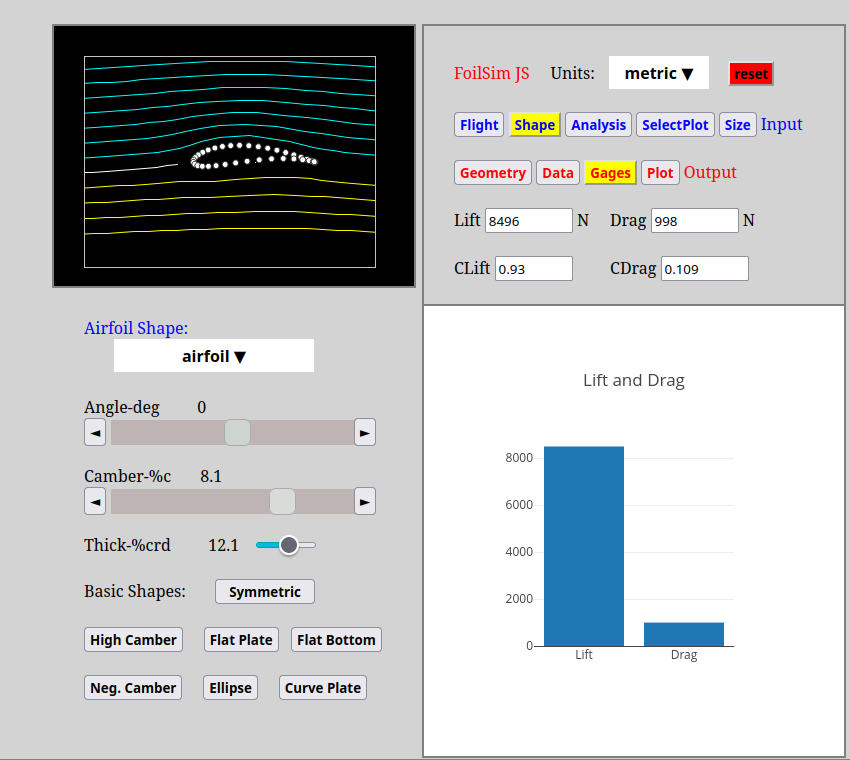
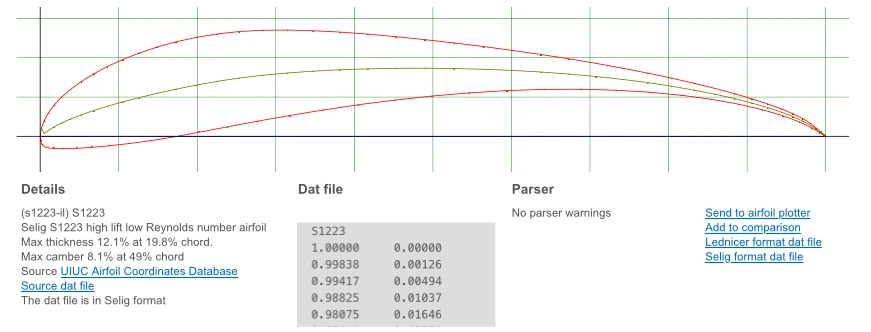
In this project I used NASA's FoilSim III to create an airfoil shape based off of the Selig S1223 airfoil,
for maximum lift at low velocity. Many parameters can be adjusted in FoilSim to realistically calculate
the lift, drag, coefficient of lift, and coefficient of drag of the airfoil.
For example, the flight velocity, altitude, and planet can be selected.
For the airfoil itself, angle of attack, camber, thickness, and size can be changed.
Through this, the data points of the airfoil can be copied to build the airfoil yourself.
FoilSim is available here.
Plotting Airfoil Data Excel
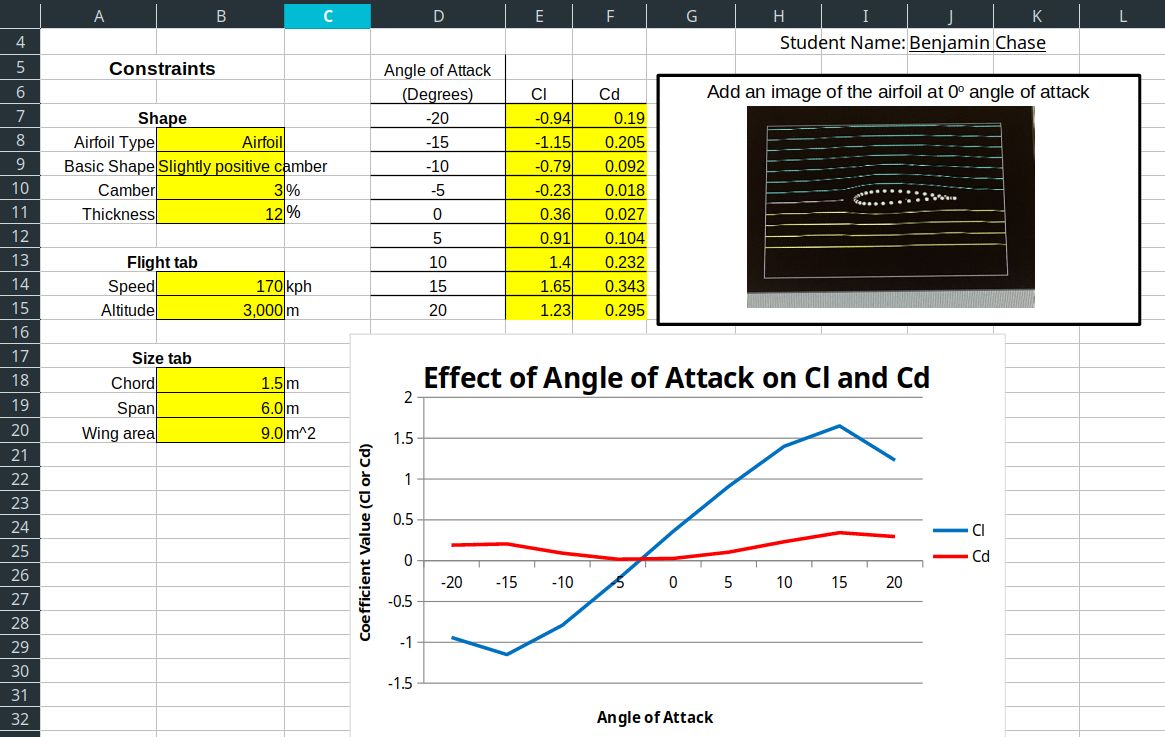
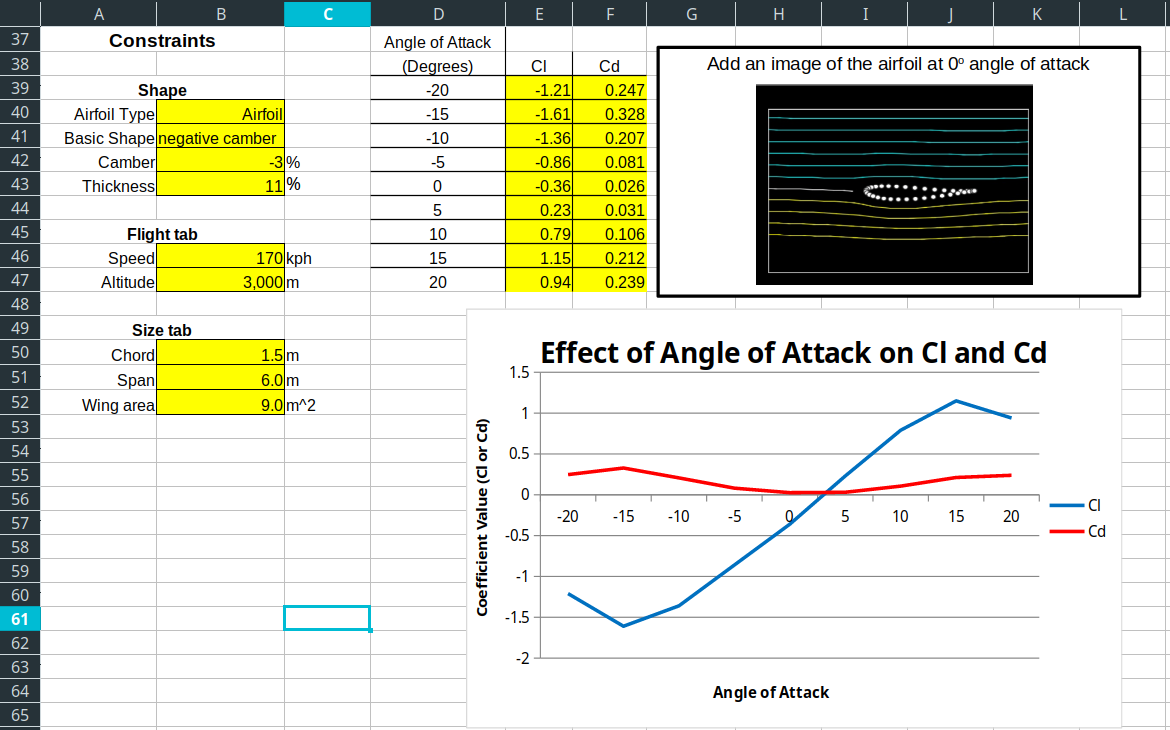
For the first step in this project, I designed two airfoils using FoilSim including a slightly positive camber airfoil and a negative camber airfoil. I recorded the coefficients of lift and drag at angles of attack ranging from -20 degrees to 20 degrees for each airfoil. The data from the charts and the graph illustrated that the airfoil with positive camber produced far greater lift and additionally had a higher coefficient of lift than the negative camber airfoil. I based my final design on this and the specifications of the Selig S1223 airfoil to use a high camber of 8.1% and a thickness of 12.1% to maximize lift at a low velocity (30 mph).
Data Formatting and Designing in Autodesk Inventor
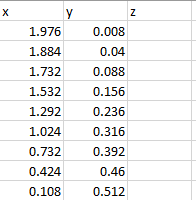
The next step was to format the data points from FoilSim. FoilSim allows the user to copy a table of data points, but they are separated with spaces and include coefficient of lift and velocity at each point. So first, I used the "Convert to Data" feature in Excel to convert the text into columns of data points. Next, I deleted the coefficient of lift and velocity columns as they were unnecessary for this use. Overall, I wanted to import the points into Autodesk Inventor, which does not parse spaces in data. So I used the Find/Replace function in Excel to remove all spaces from the data. After this, I set the textual data points to be "Numbers" in Excel. Then, I added a blank Z column for Excel to use. Finally, I sorted the upper camber points from smallest to greatest and the lower camber points from greatest to smallest to allow Autodesk Inventor to connect them properly.
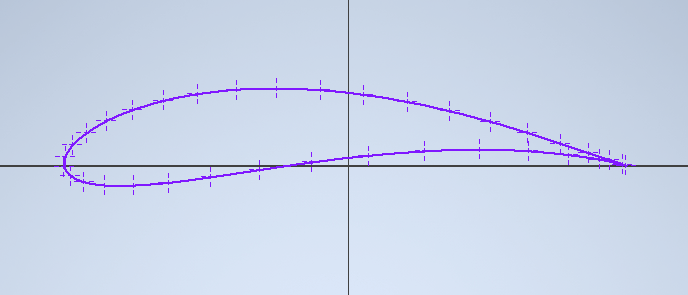
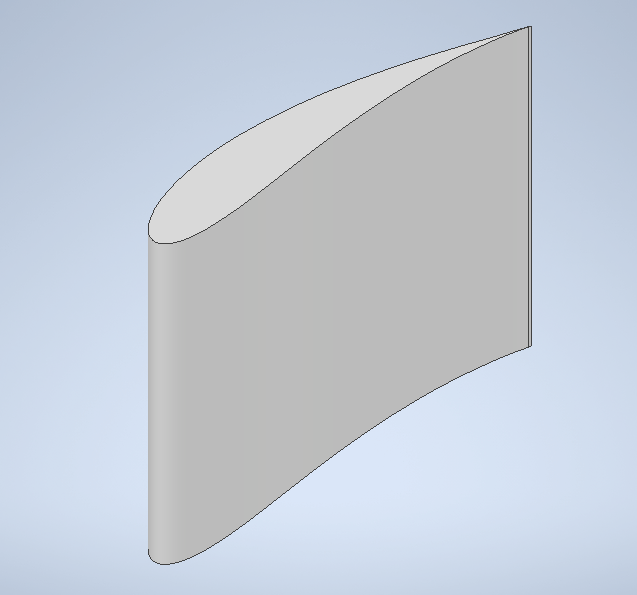
Once the data formatting was complete, I was ready to import the data into Autodesk Inventor. To do this, I created a sketch and imported the data points from the Excel file created previously. To ensure the airfoil had a smooth surface, I used the "Import and Connect with Spline" option. A spline was created, connecting all points except for two end points on the trailing edge. After connecting the last points manually, I could extrude the design to a height of three inches and send it to my 3D printer!
Building the Airfoil
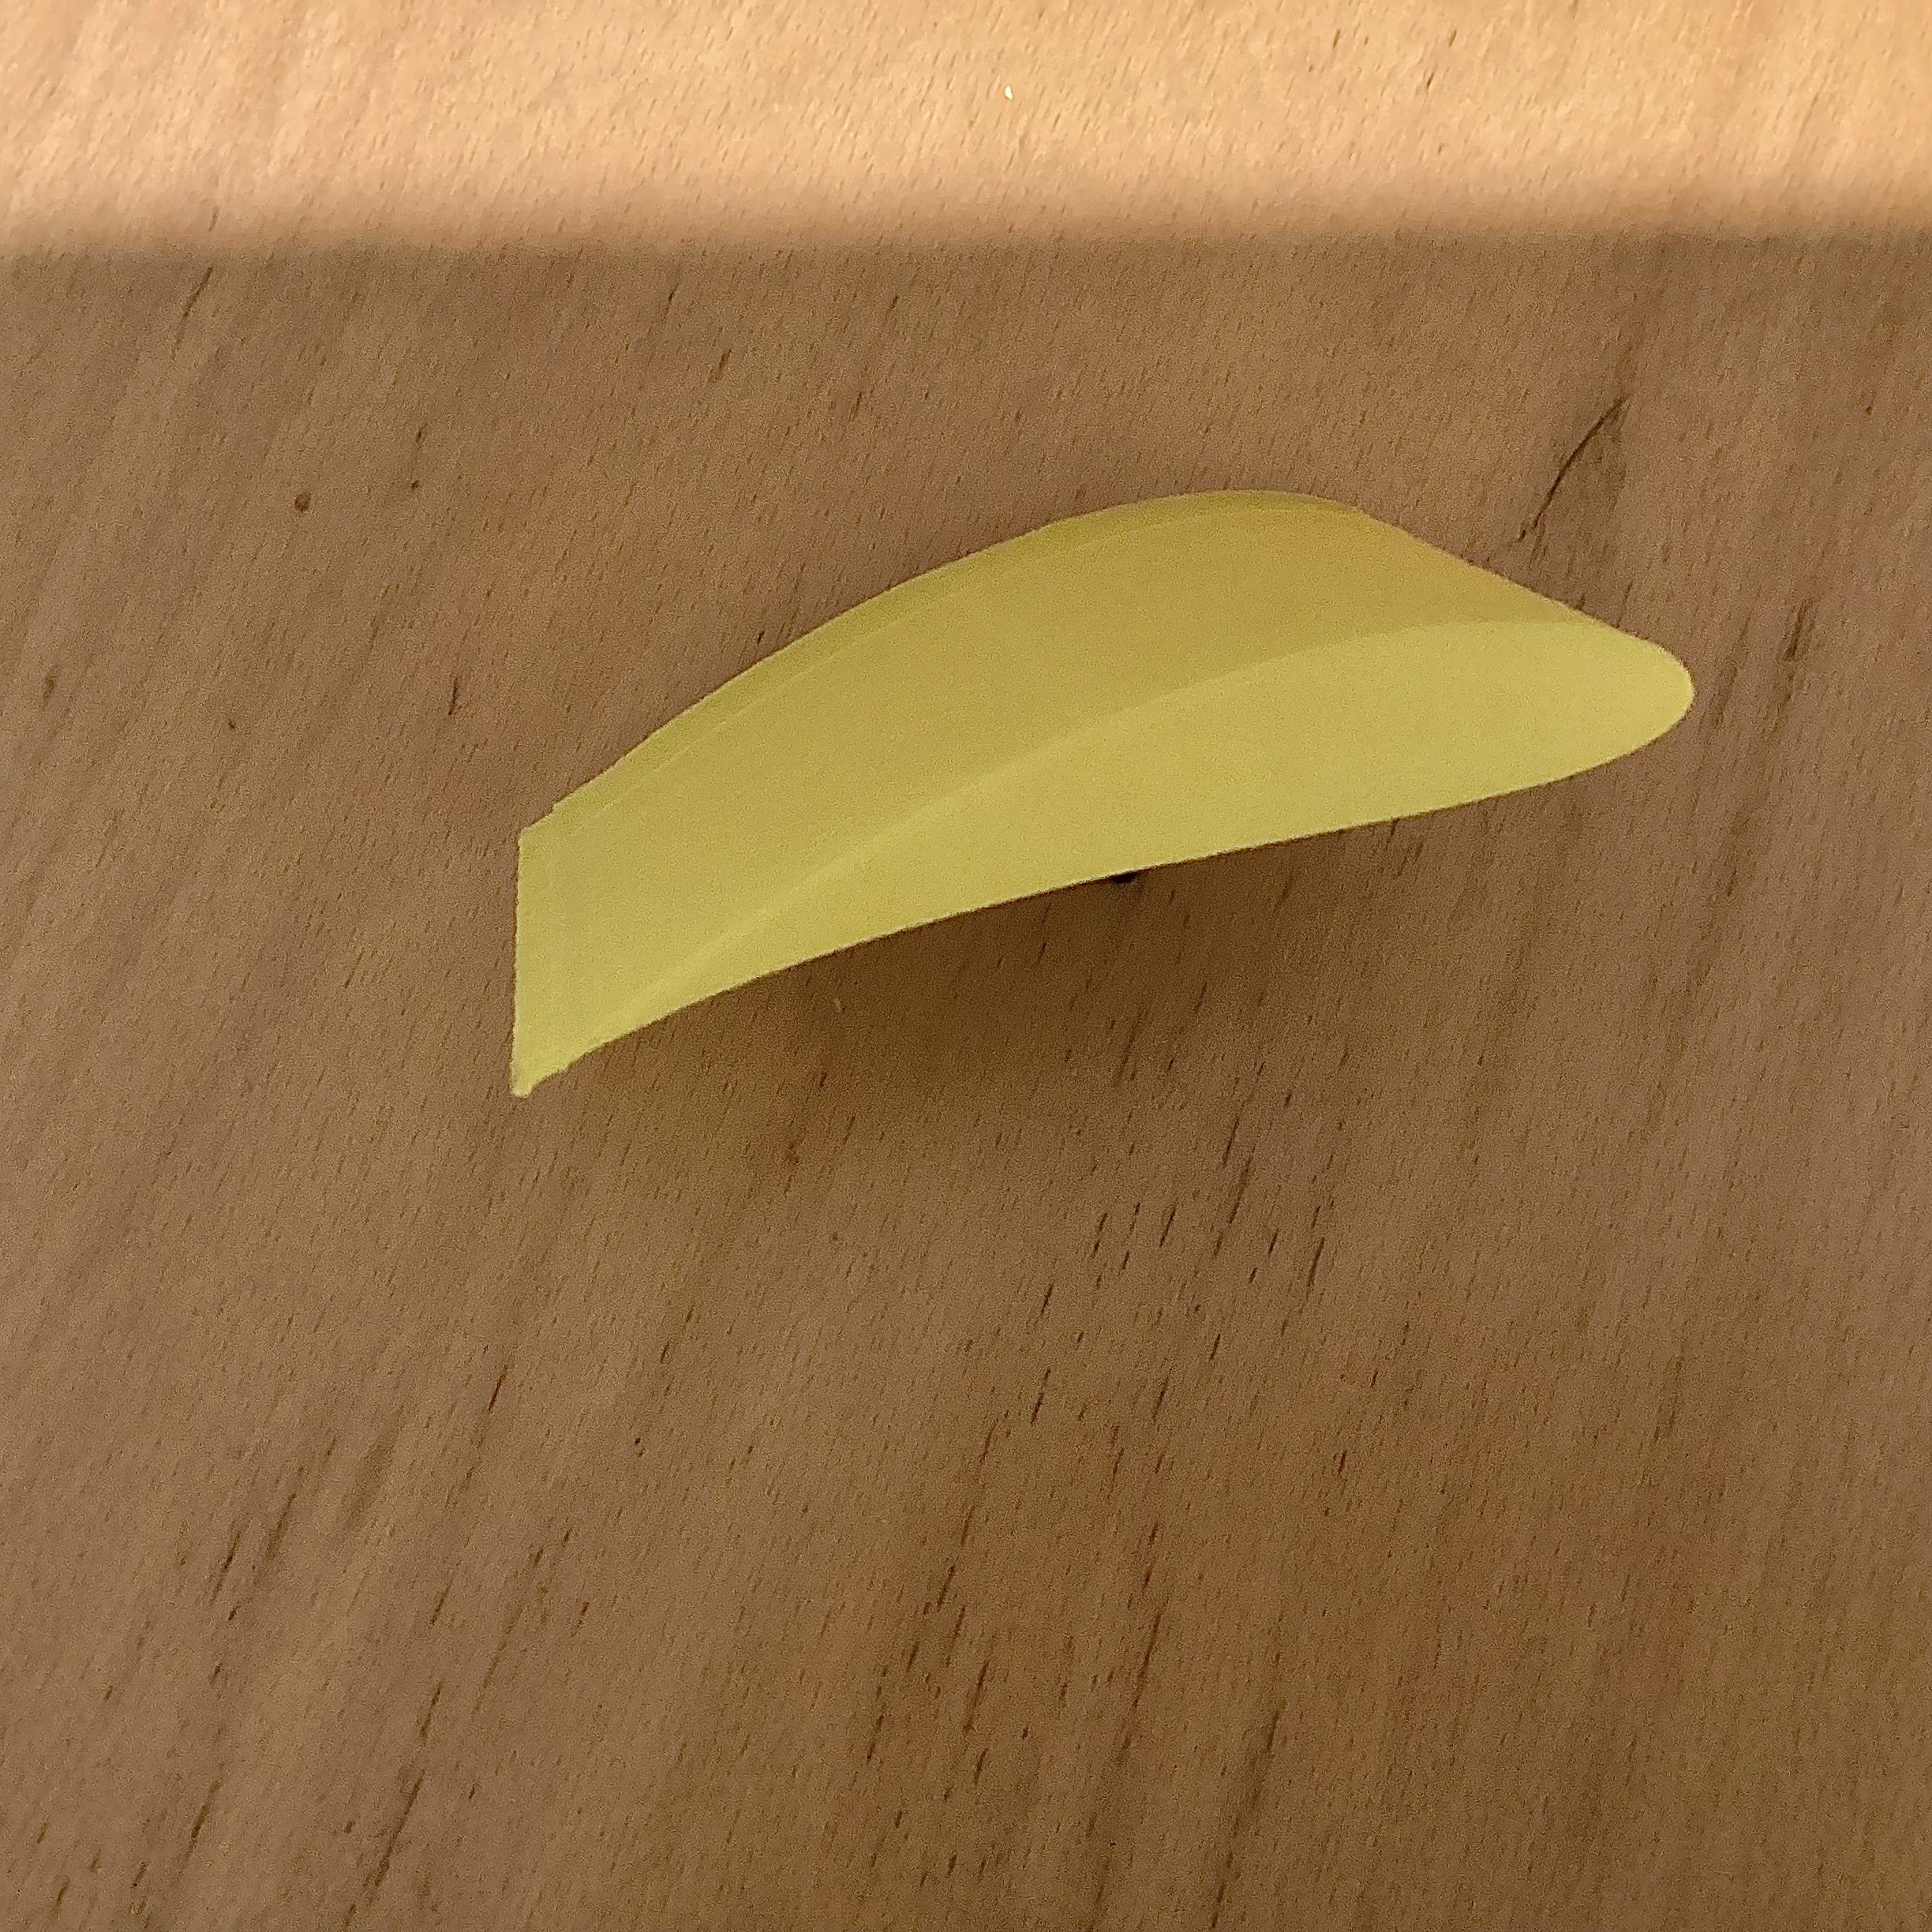
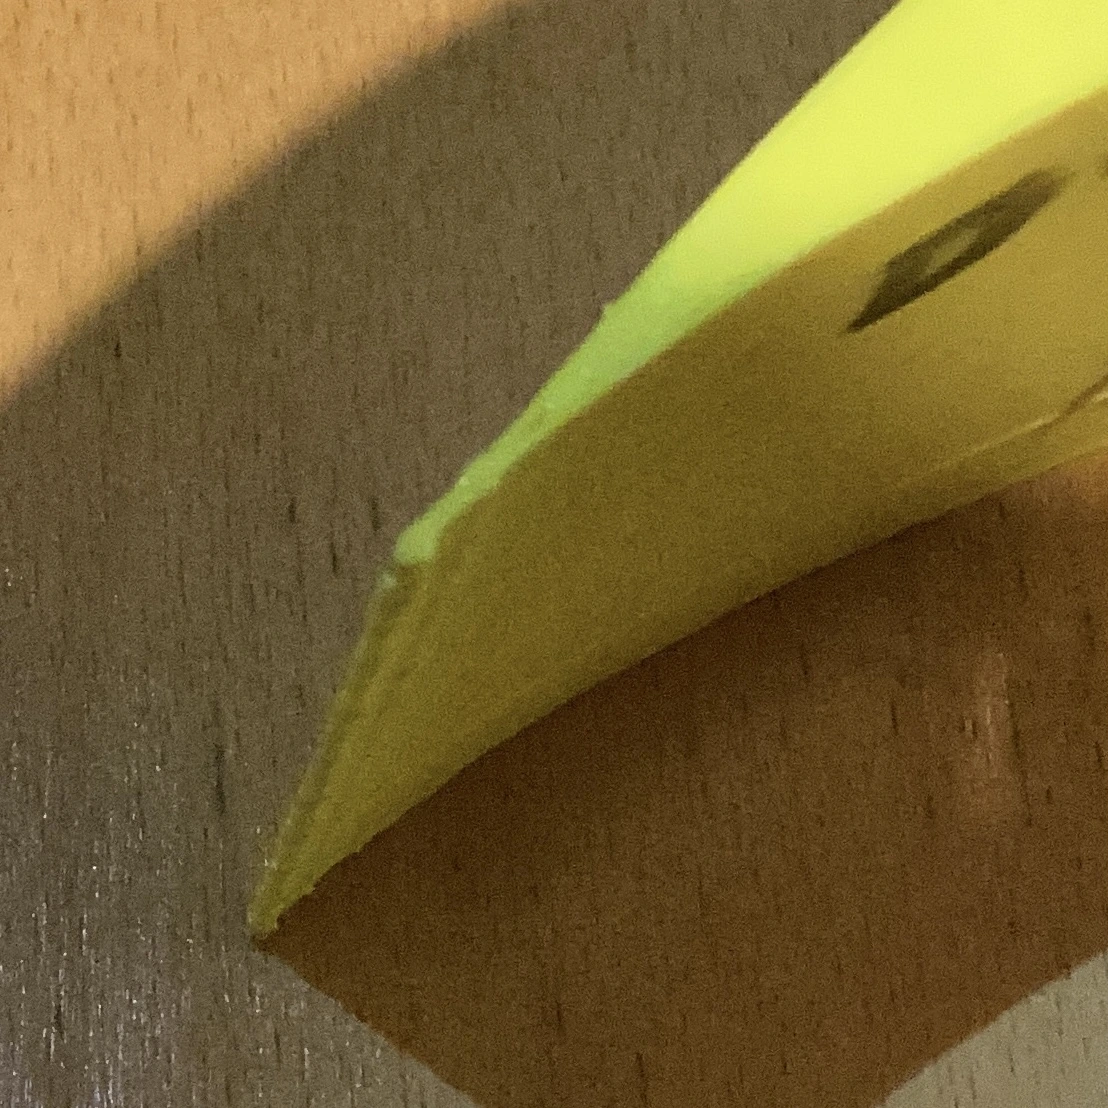
To build the airfoil, I used my 3D printer to create my design from Autodesk Inventor. I also sanded the trailing edge due to some overextrusion while printing. The 3D printer did an almost perfect job, but the thin trailing edge was slightly too thick.
This was far easier and thus prone to less error than using manual methods, such as cutting foam. Cutting foam involves creating multiple mirrored templates of the airfoil, and attaching these to a block of foam. Next, the foam is cut using a hot wire foam cutter. During this process, it is easy to melt too much foam, or to shift the templates. A 3D printer can produce a very accurate model of the airfoil, except for the thicker trailing edge. The trailing edge can just be sanded down to retain scale model accuracy through a sharp trailing edge.
Purpose and Testing
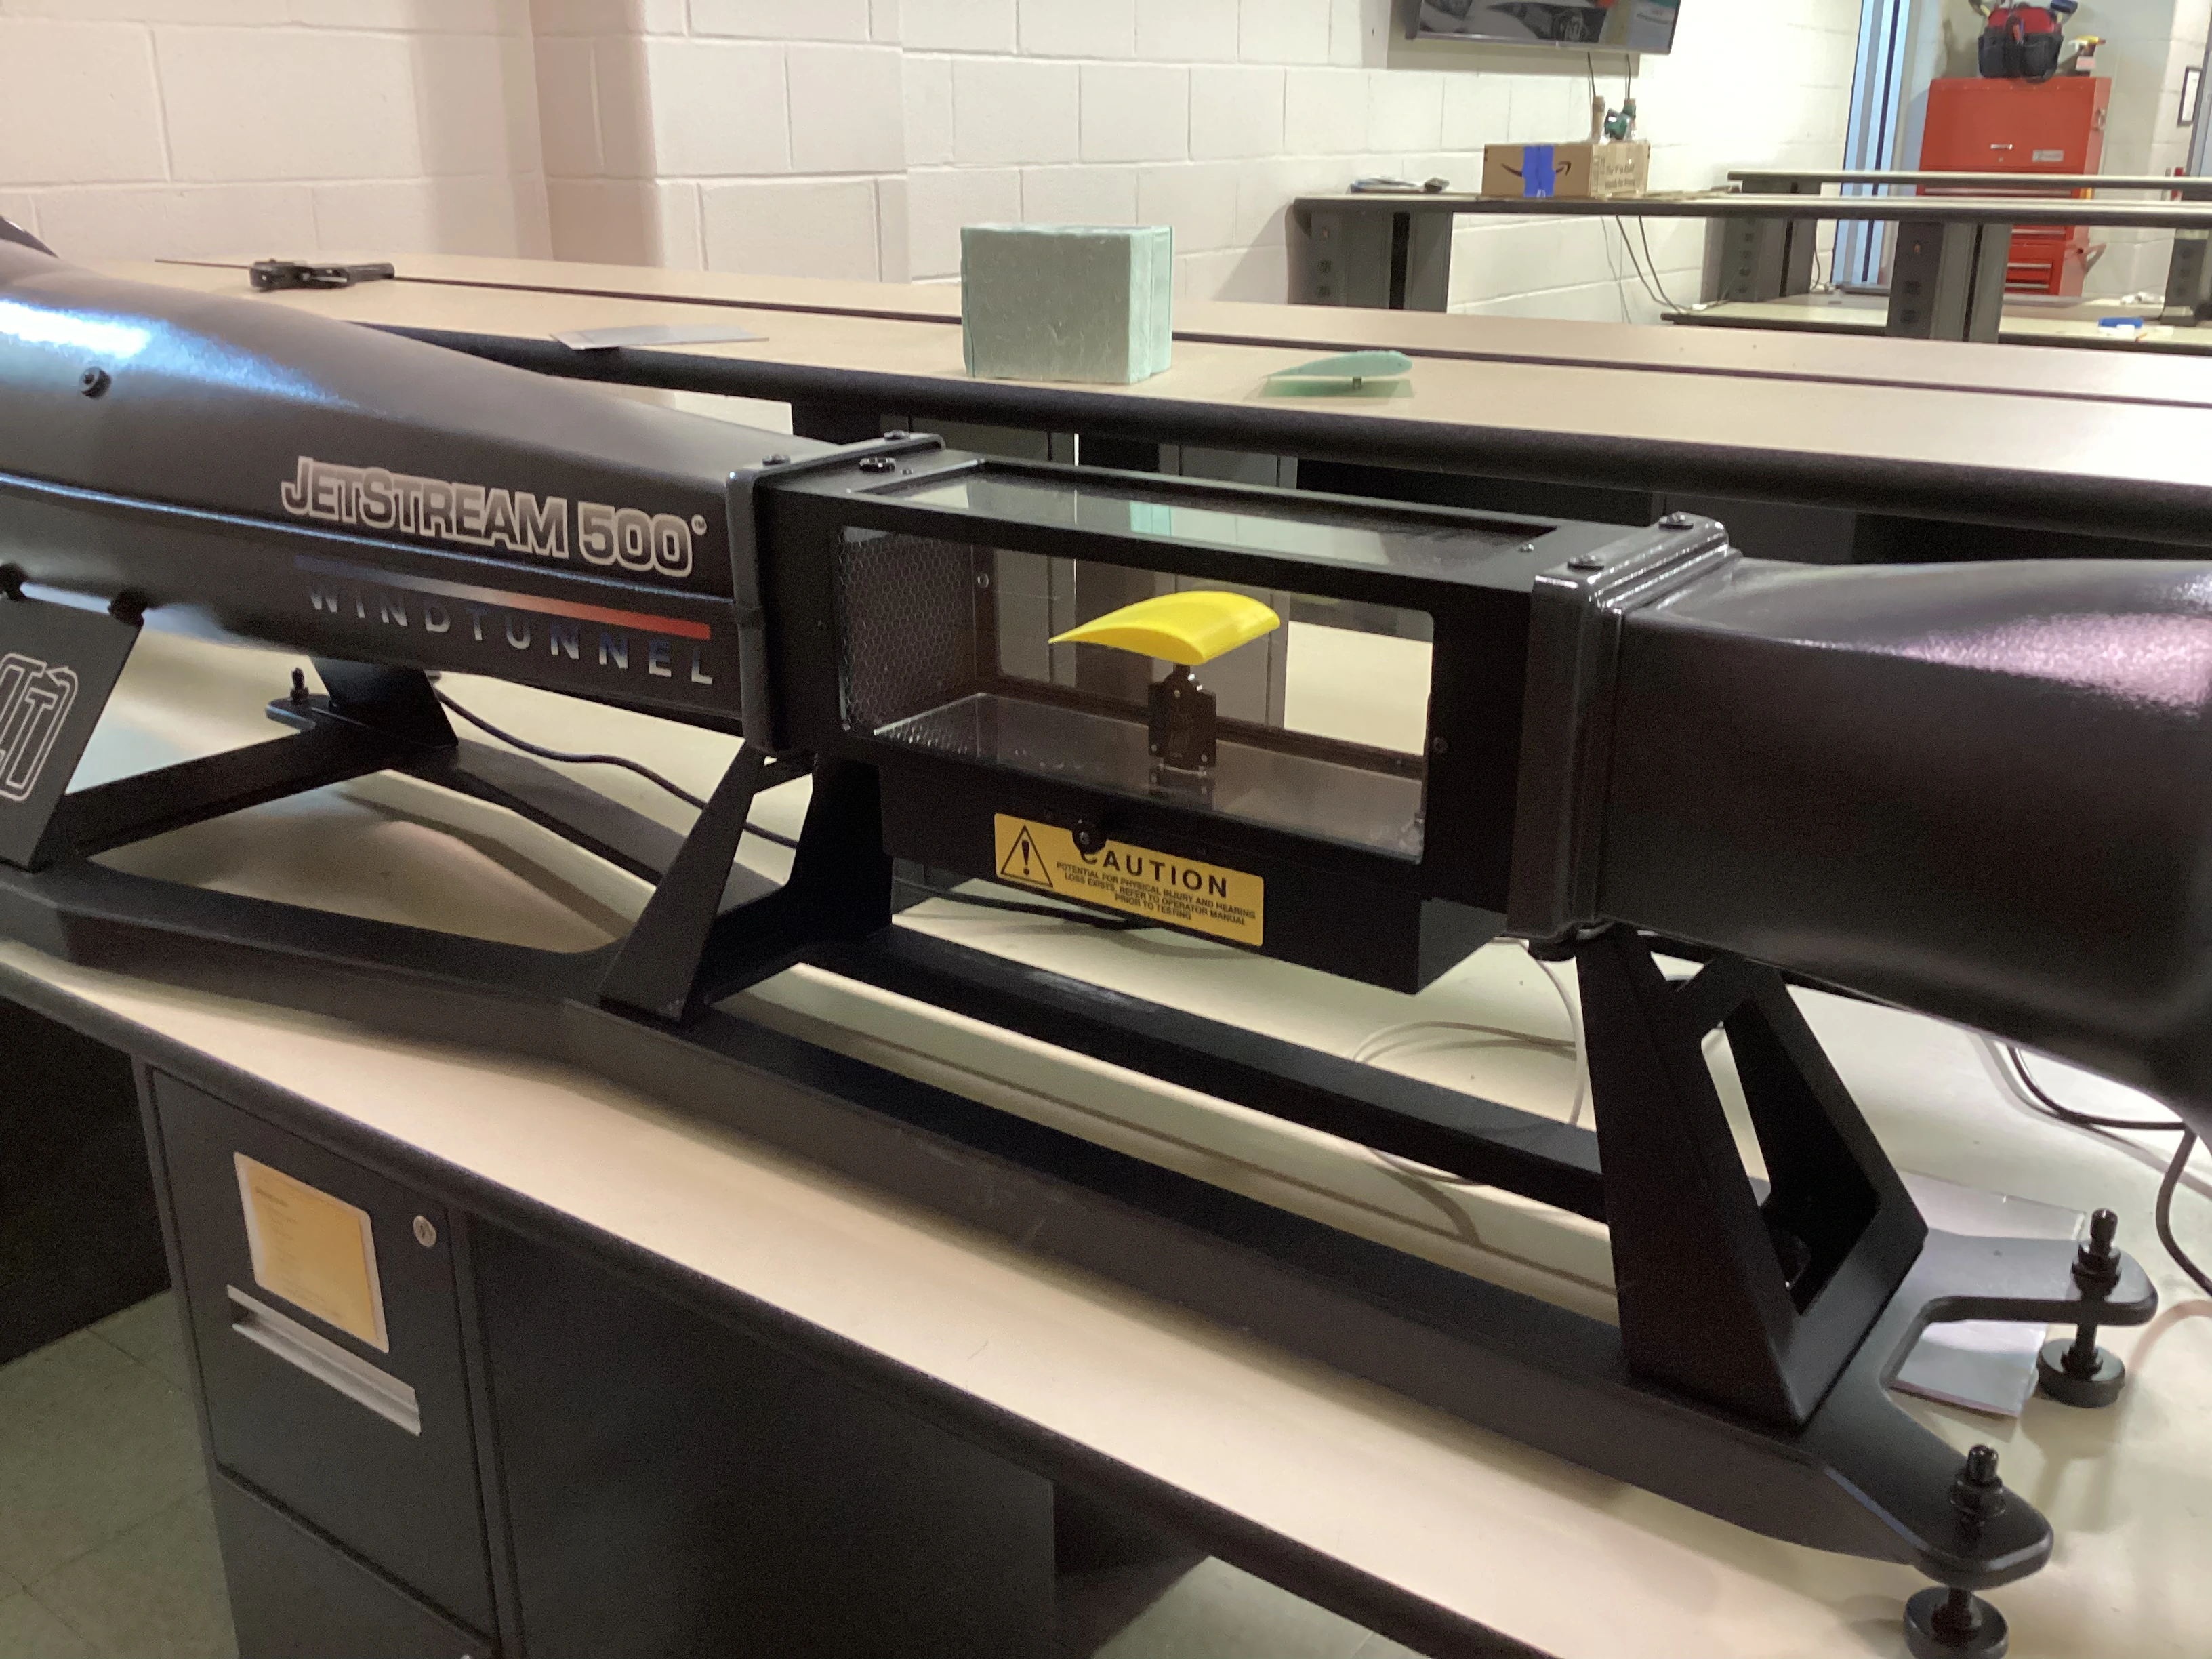
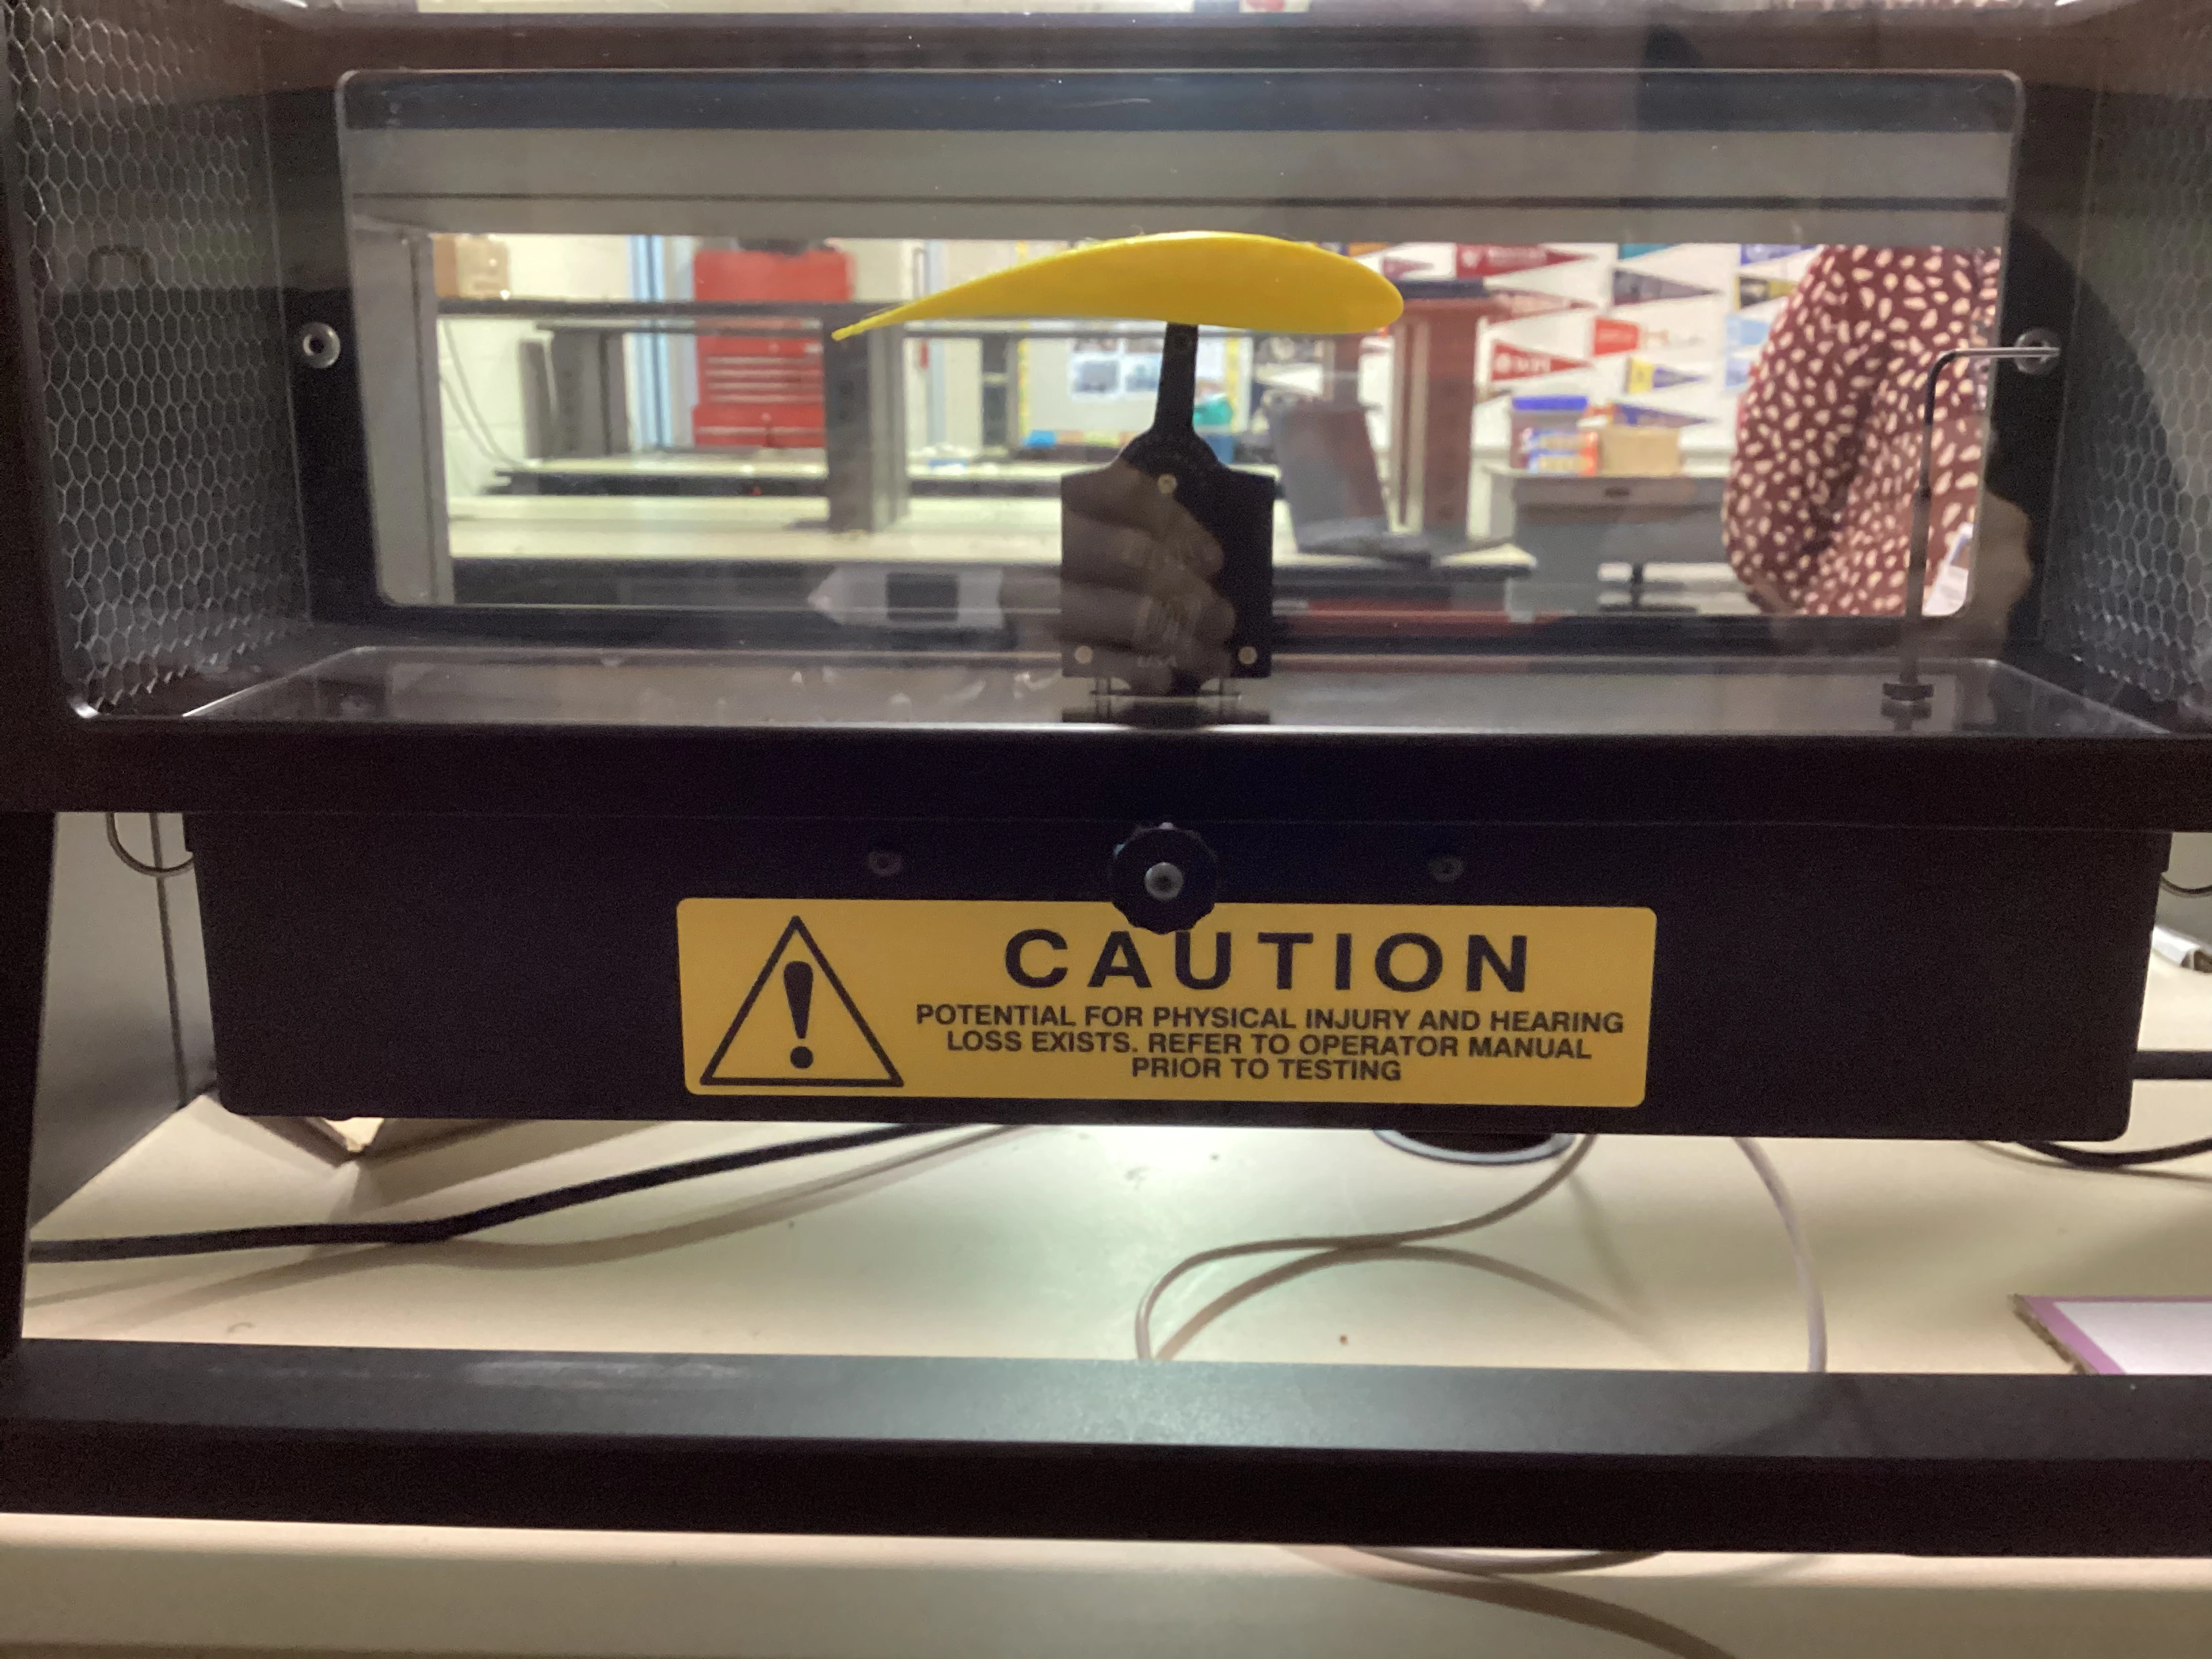
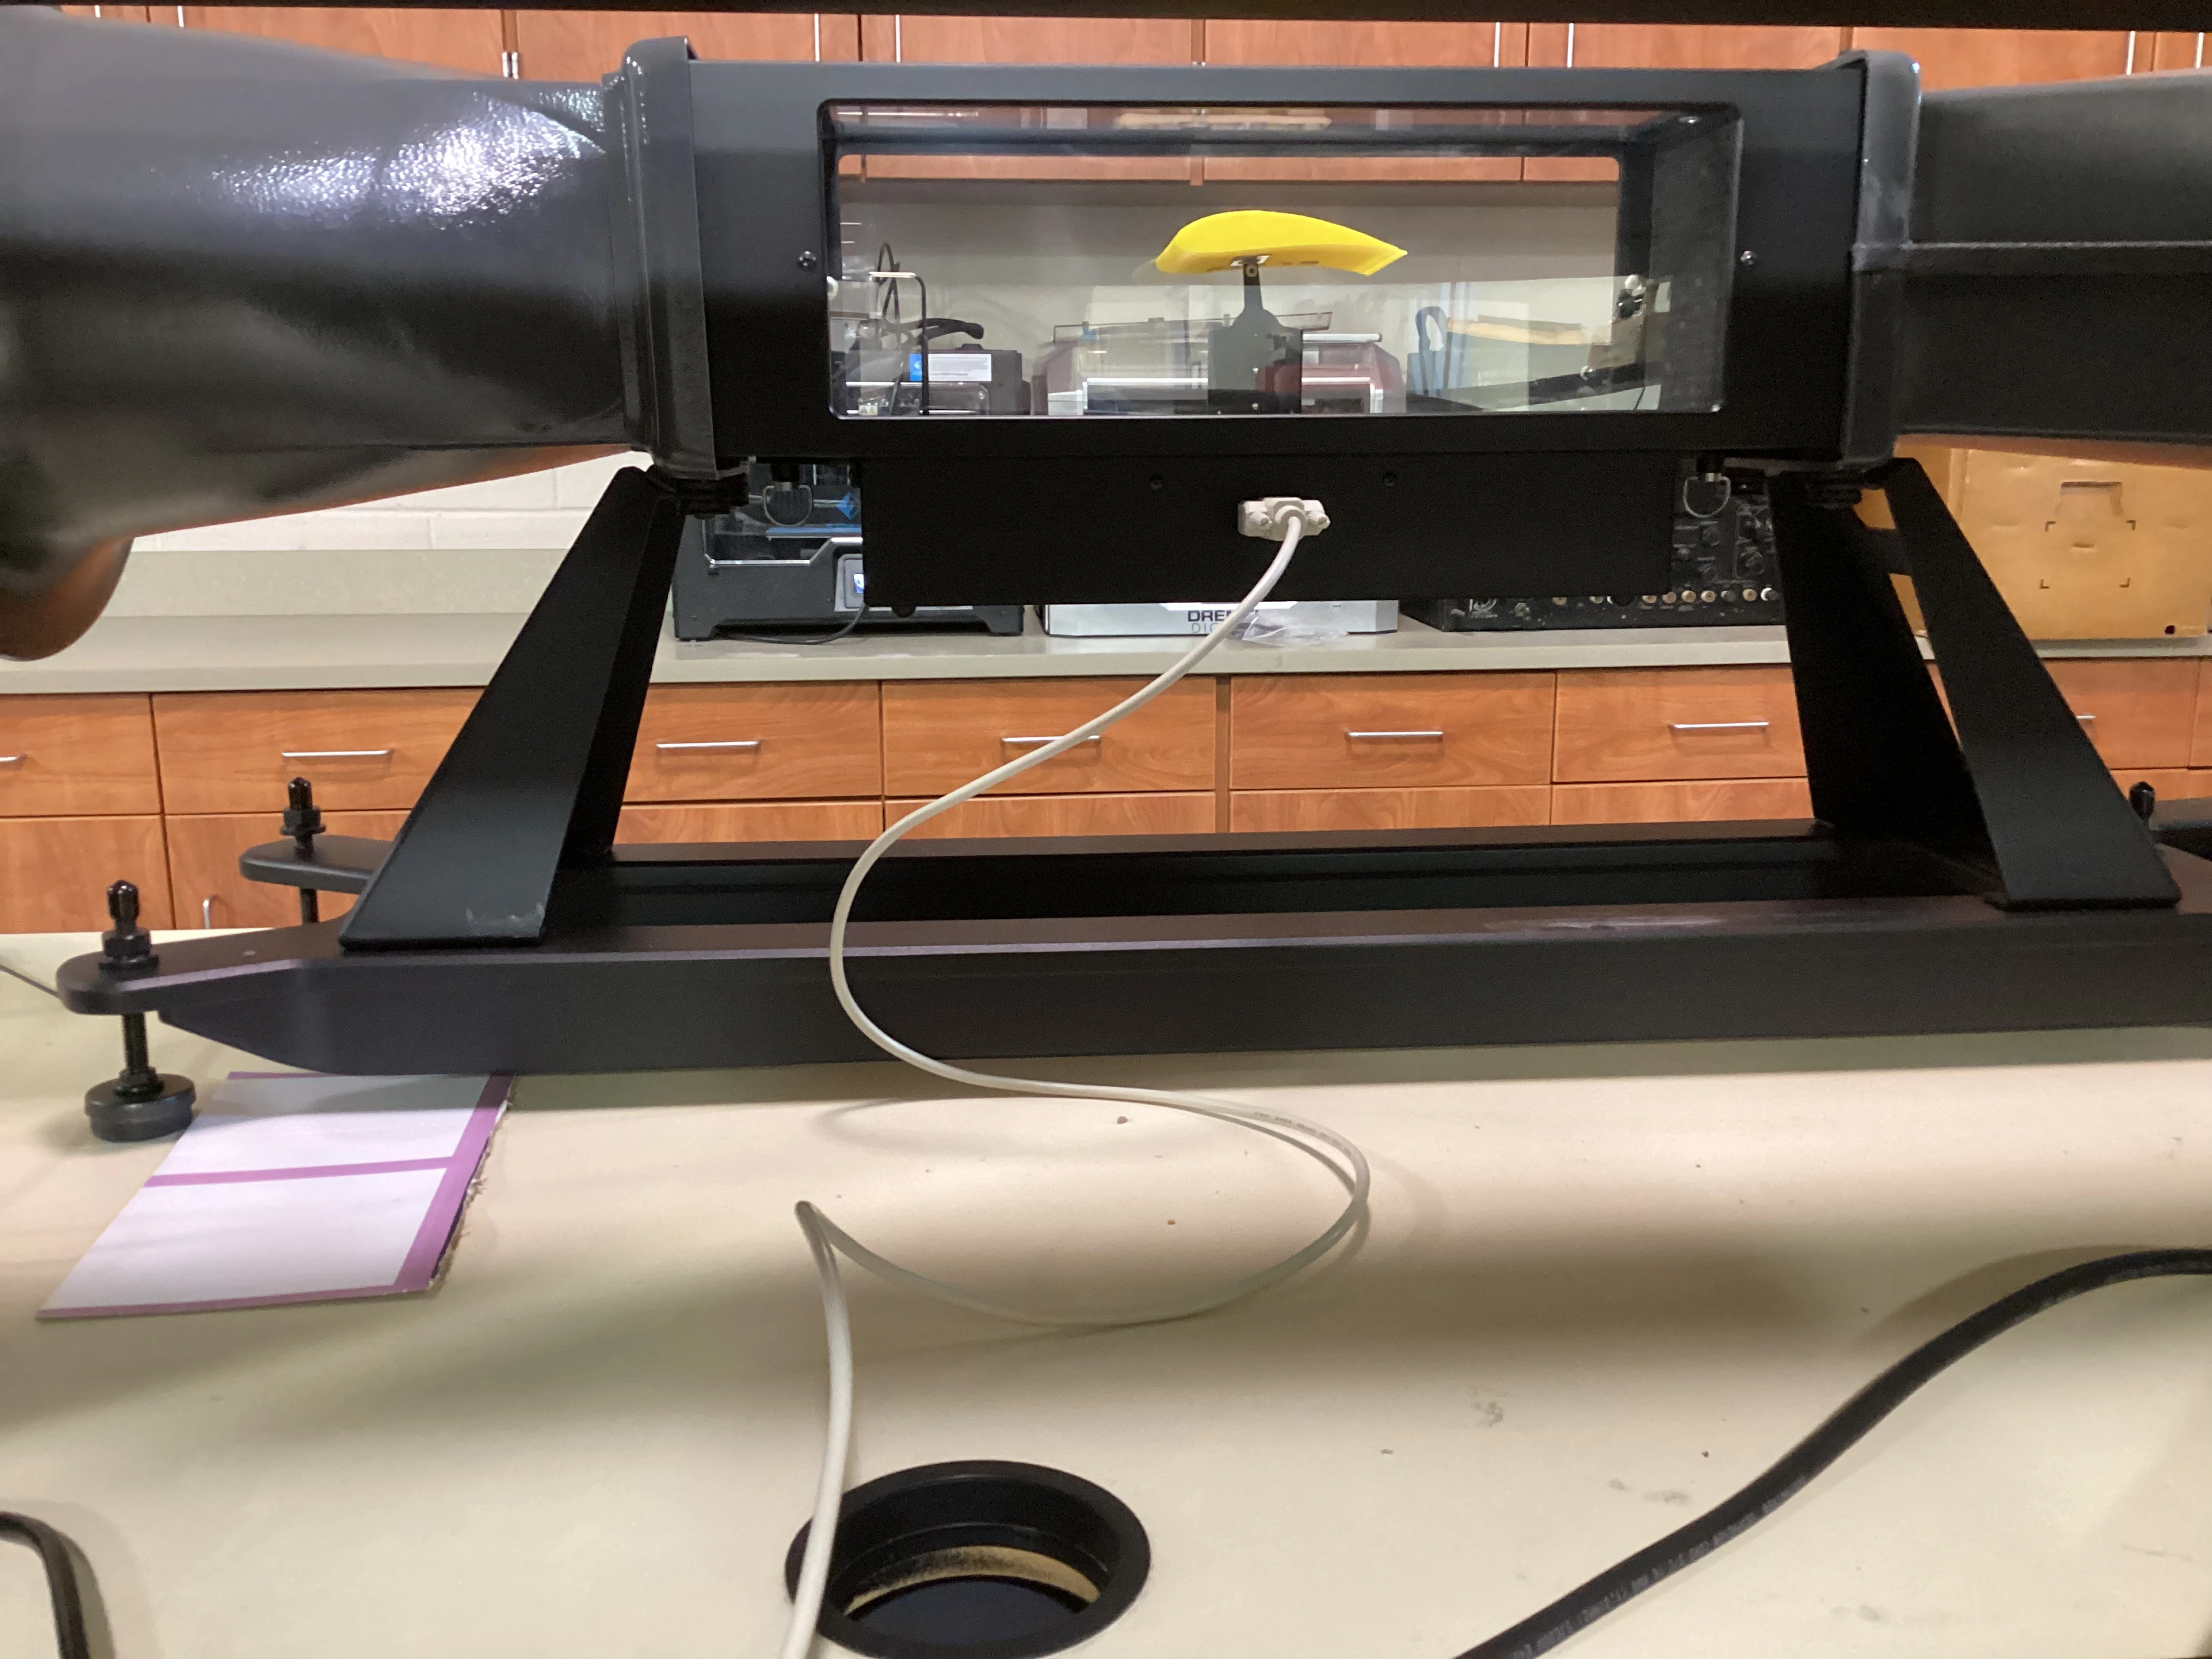
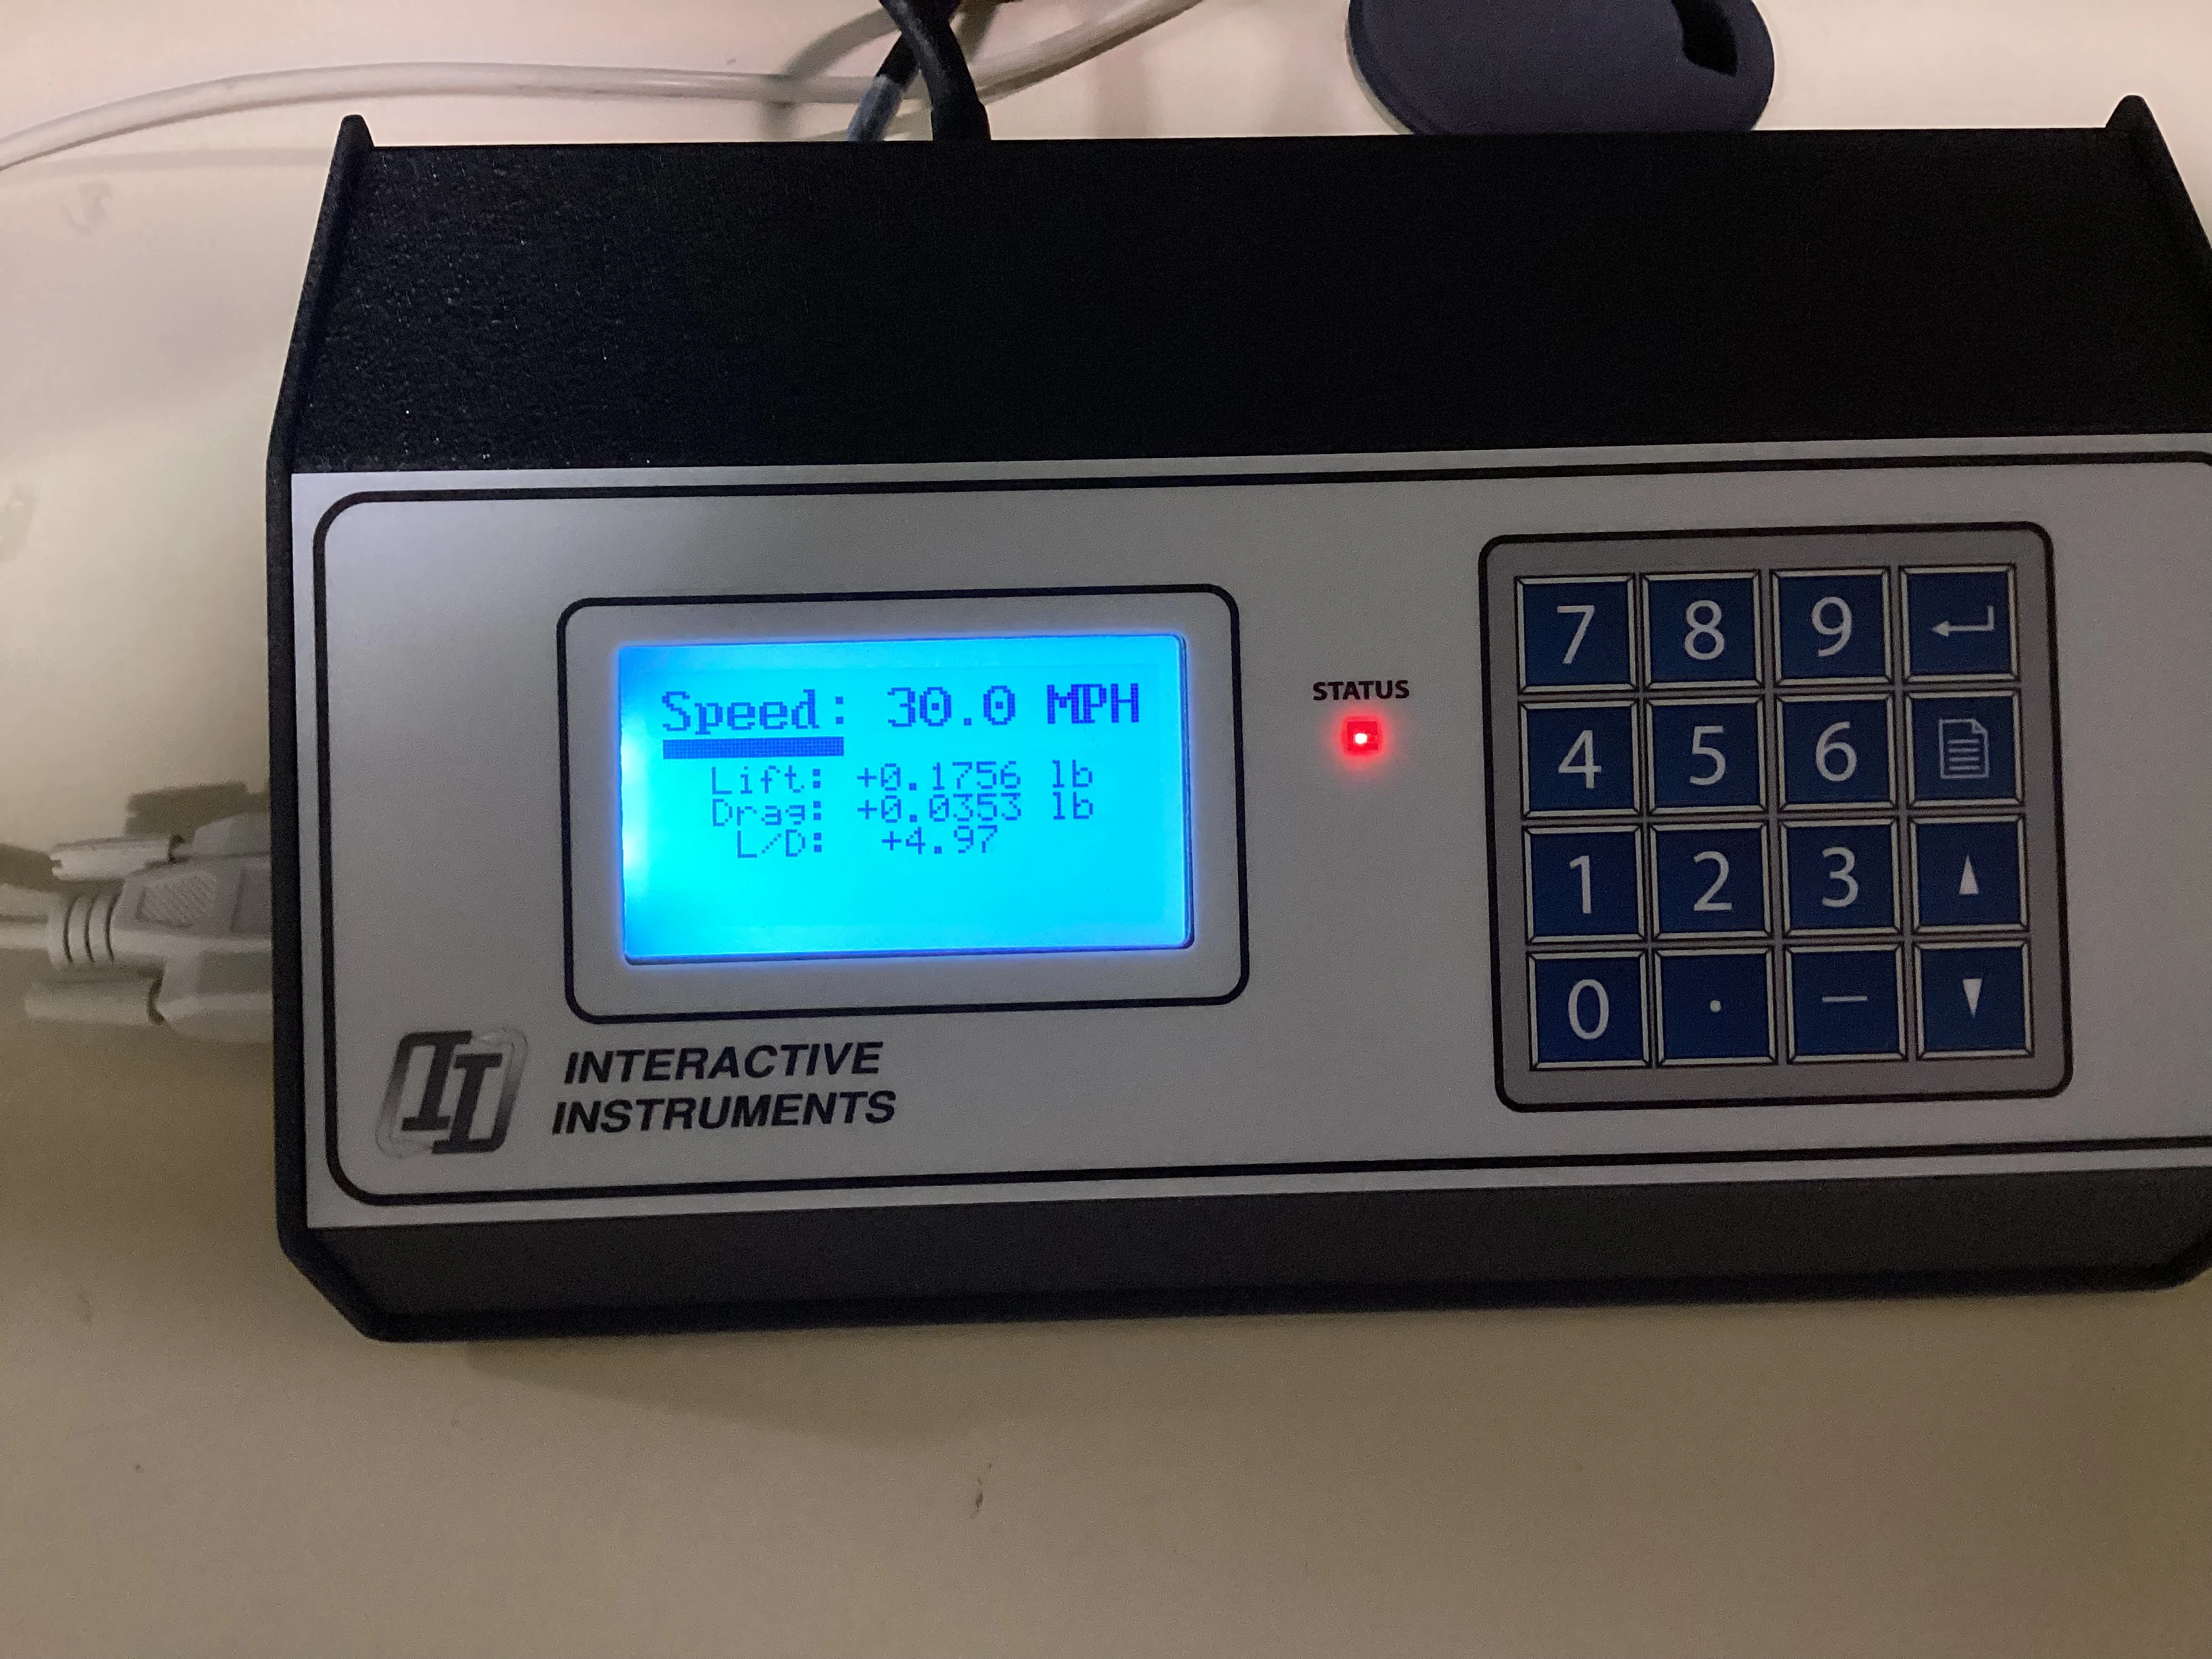
Wind tunnel tests were conducted to measure the airfoil's lift (L) and drag (D). These values were used to determine the coefficient of lift (C_L) and coefficient of drag (C_D). The tests were be conducted in a wind tunnel to maintain a steady airflow velocity. The airfoil was be mounted to an armature on a load cell which could measure all forces in the X, Y, and Z directions. This let me determine lift and drag generated at different airflow velocities. Pressure was calculated using the altitude (about sea level), and velocity was measured using a airflow velocity sensor (anemometer).
Test Results
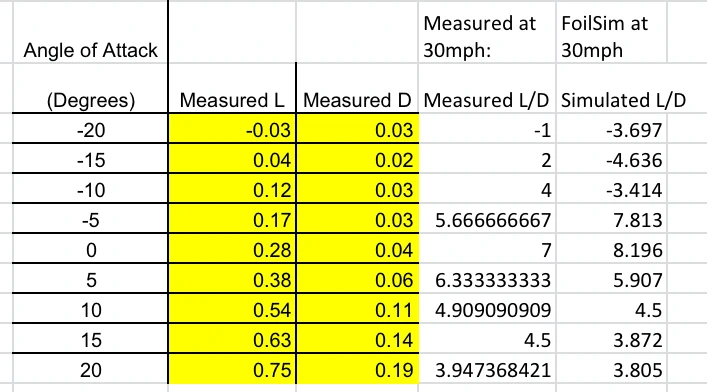
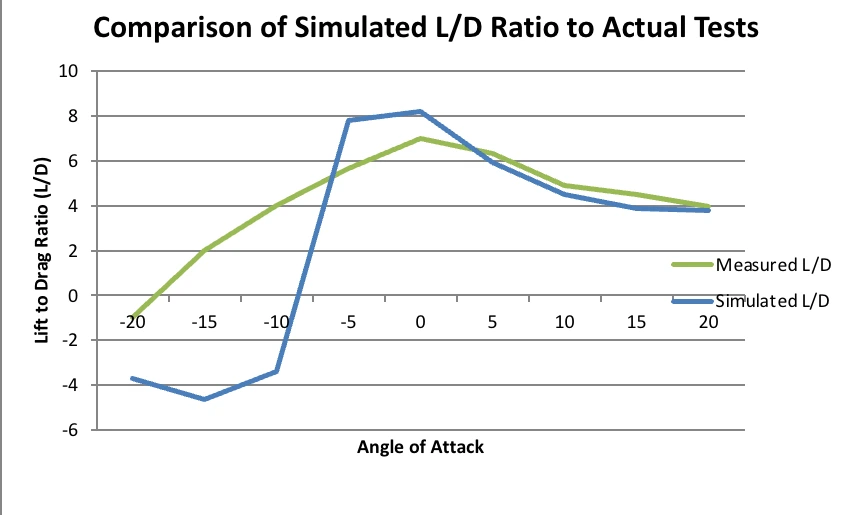
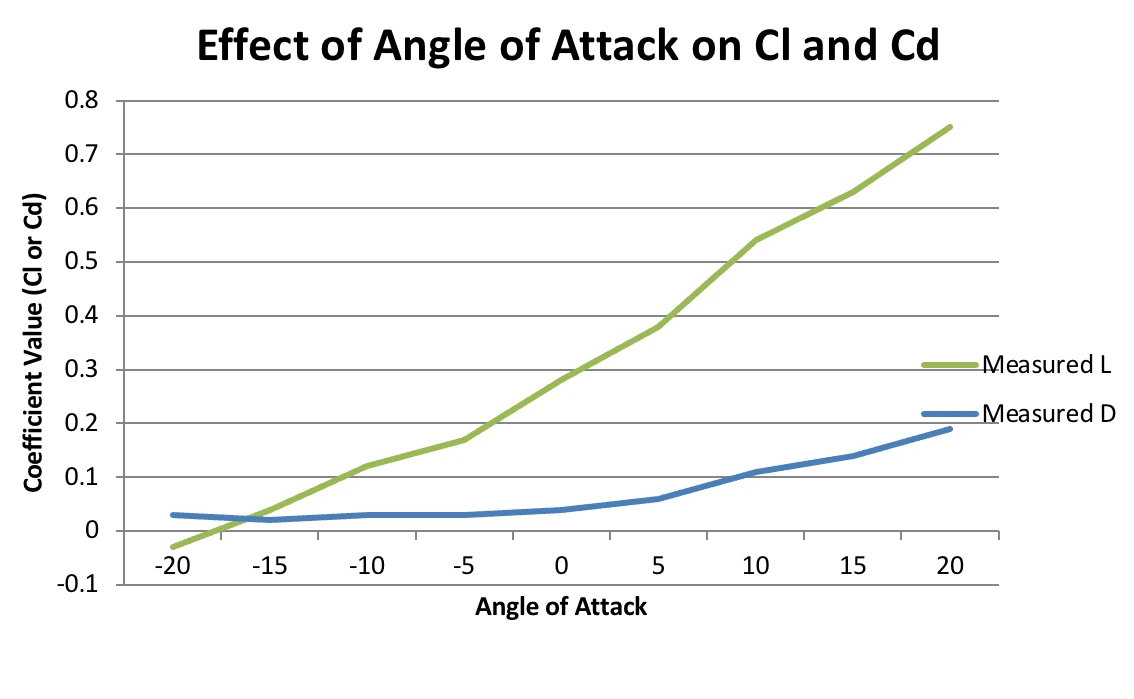
Shown above are comparisons between measured lift and drag (lbs) at various angles of attack. Additionally, measured lift to drag ratios at various angles of attack and their respective simulated values are also shown.
These results show a direct corellation between similar lift to drag ratios of the tests and simulations at higher angles of attack. The lift to drag ratio approaches 4.0 for both the measured and the simulated values as the angle of attack increases to positive 20 degrees. Conversely, the measured results show a gradual increase in lift to drag ratio from negative 20 degrees to 0 degrees, while the simulation shows negative ratios from -20 to -10 degrees AOA, but sharply increases to 7.8 at -5 degrees AOA. This could be due to issues in the construction of the airfoil or inaccuracy while testing the airfoil using the wind tunnel and load cell.
Conclusion
During this project, I learned how to design an airfoil and export its geometry into Excel. Then, I learned how to import the points into Autodesk Inventor accurately and how to connect them smoothly using a spline. Additionally, I learned how to use a hot wire to cut foam accurately and precisely.
Next time, I would like to experiment with different types of airfoils and different chord and thickness parameters. It would also be very interesting to see how my airfoil design compares in terms of performance with the Seling S1223 airfoil I based it on. Also, before 3D printing other airfoils, I would print multiple calibration models and potentially redesign the airfoil to reduce the thickness of the trailing edge from printing. This would help to maintain the realistic scale of the model to a full-size airfoil.